Category Archives: Growth
Illinois Tool Works: Innovation, Growth, Above-Average Yield and Low Valuation – Seeking Alpha
Illinois Tool Works: Innovation, Growth, Above-Average Yield and Low Valuation – Seeking Alpha: “This is part seven of a seven-part series that is looking at the incredible opportunity that a cyclical company can represent as earnings recover coming out of a recession. A primary objective of this series is to illustrate that price drops of well-established companies are usually temporary even after earnings are cyclically weak.
Part one, 6 High Profile Industrials With Staggering 3-Year Performance, provided a cursory view of six industrial companies. In the part prior to this one, we looked at Ingersoll-Rand (IR) in Rand: Profit by Investing in Recovering, Large, Well-Entrenched Cyclicals. You can find the entire series here.”
Going for Growth (Part 3): Forecasting Future Earnings the Key – Seeking Alpha
Going for Growth (Part 3): Forecasting Future Earnings the Key – Seeking Alpha


Introduction
It is my belief that as investors in common stocks, and whether we are aware of it or not, we are all buying earnings. Because ultimately, long-term investor rewards are going to be a function of two primary factors; the most important of which is the earnings power of the companies invested in. The stronger and faster that a business can grow their profits, the more valuable it becomes to the shareholders. Furthermore, if income is the goal, the level and rate of growth of dividends are also directly tied to earnings growth. The second important factor is valuation. If you find a company with good earnings power, you should do very well over the longer-term, as long as you don’t do something foolish like over pay to buy those earnings. This is why I emphatically state, you make your money on the buy side.
When the above principle is applied to my definition of a growth stock, the following dynamic is revealed. If you buy one dollars worth of earnings today, with the expectation of 15% earnings growth, then your future earnings five years out would be two dollars. In other words, at a 15% growth rate it takes approximately 5 years to double your earnings. If you expect 20% growth, then your dollars worth of earnings you bought today will grow to two dollars worth of earnings in just over 3 1/2 years. And if you’re lucky or smart enough to find a company capable of growing earnings at 25% per annum, then you will have two dollars worth of earnings in just under three years. The exceptional future returns that can be derived from either of the examples above, is functionally related to the significantly greater earnings power you then possess and achieved over such a short period of time. These examples represent quintessential validation of the phrase – time is money.
A few comments on analyst estimates
In Part 2, I provided several examples of future earnings expectations based on consensus analyst estimates. I have found there to be a lot of confusion and misunderstanding regarding the accuracy and validity of analyst estimates. I believe the problem rests with the manner in which misses and beats are scored. In truth, I feel it is unreasonable to expect future earnings estimates to be too precise. All one should really ask is that the estimates provide a reasonable range of achievable and acceptable probabilities and accuracy. In other words, if the consensus estimate says the company will earn $2.00 per share, and the company reports $1.98 per share, this is generally considered a miss. In my view, the example above was an accurate estimate within a reasonable plus or minus range.
Therefore, I would like to see a study where analyst estimates are scored based on achieving an accuracy rate of plus or minus 5%, then plus or minus 10%, then plus or minus 15% and so on. I believe a study like this would show a significantly higher percentage of accuracy of analyst estimates than most studies currently suggest. However, the real point I’m trying to make is, that although I believe analyst estimates are more accurate than most people give them credit for; I also believe that they only represent a good starting point prior to a more comprehensive research effort. In other words, the analyst estimates offer a great screening function, but before I will lay my money down, I need to validate their expectations in my own mind.
Forecasting Future Earnings is the Key
As investors, I believe we cannot escape the obligation to forecast; our future results depend on it. However, our forecasts should not be mere prophecy or simple guessing. We should not play hunches, instead, we should attempt to calculate reasonable probabilities based on all the factual information that we can assemble. Even then we should acknowledge and understand that the best we can do is develop forecasts that will fall within a reasonable range of probabilities. My objective is to use analytical methods that provide me reasons to believe that the relationships that have produced earnings growth in the past will persist in the future to a level high enough to satisfy my definition of a growth stock. As Warren Buffett so eloquently once put it, “It is better to be approximately right than precisely wrong.”
Most importantly, forecasting is a process and the actual act itself can vary significantly from company to company and industry to industry. Therefore, I can only provide concepts and generalizations of the forecasting process that I personally use. Complete books can, and perhaps should, be written on this important subject and vital component of what I consider true investing to be all about. With that said, there are no shortcuts. Whether you are buying growth stocks or dividend paying stocks, or any other investment, you need to have some rational and, hopefully, reasonable expectation of the future. That can only be accomplished, and must be accomplished, by a forecasting process. Therefore, what follows is offered as a general overview and a few simplistic examples of how forecasting future earnings can be approached and accomplished.
I typically approach the forecasting process from both a macro and micro evaluation. With a macro perspective I focus on what I believe are obvious areas that offer major future investment opportunities. For example, a study and analysis of demographics can be quite useful. In the United States, and throughout much of the rest of the world, there currently exists a bi-modal distribution of our population. Here at home this is often referred to as the “Graying of America” and the “baby boomer” generation. A study of the consumption tendencies of these and other demographic segments can allow you to make informed decisions as to the future health of several industries that will serve these large and growing markets. Healthcare and financial services focused on providing retirement benefits are two obvious examples that come to mind. You may have noticed that several of our examples in Part 2 were healthcare related.
Although there are numerous opportunities in healthcare, forecasting the future potential of a pharmaceutical or biotech company is a straightforward but often precarious process. The logical place to start is by evaluating the company’s current portfolio of drug candidates in their pipeline, and where they are in the various stages of regulatory filing. Personally, when I do this, I place most of my emphasis on drug candidates in phase 3, and less emphasis on drug candidates in phase 1 or 2. The majority of phase 1 candidates actually fail. In contrast, the majority of drug candidates in phase 3 usually make it to the marketplace. Therefore, it’s simply a matter of attempting to calculate the sales potential and/or blockbuster status of pending candidates. Although this is difficult to do with great precision, it can be done accurately enough that a reasonable estimate can be made.
Technological advancements and other scientific breakthroughs can provide a fertile ground of potential business opportunities. The current explosion in “smartphones” and other similar technology devices represent powerful and compelling areas of growth. Of course, the Internet has spawned numerous game changing industries and companies in which to explore. There are many young and very fast-growing companies that have resulted from these breakthroughs that are rapidly becoming household names and concepts. Google (GOOG), Netflix (NFLX), Priceline (PCLN), and many others too numerous to list, are examples of businesses that didn’t even exist a decade or two ago. But I caution to not overpay, and to do the work necessary to understand the business to include the competition.
Another example growth industry could be new and dynamic restaurant concepts. Companies like Starbucks (SBUX), Panera Bread Co. (PNRA) and Buffalo Wild Wings (BWLD) are just a sampling of many that have enjoyed recent success. With this type of company, forecasting the future can be as simple as evaluating how many units have penetrated how many markets, and then trying to determine what type of future growth potential remains. The same analysis would apply to companies like Decker’s Outdoor (DECK), Coach (COH), Kohl’s (KSS) and other companies in the retail or luxury goods space. Although I could go on and on, hopefully I have made my point. Forecasting is a process that needs to be approached as comprehensively as possible, but with expectations regarding precision kept within reasonable probabilities.
(Follow this link for a dynamic video of these true growth stocks.)
(Follow this link for a dynamic video of these true growth stocks.)
Challenges and Pitfalls of Forecasting
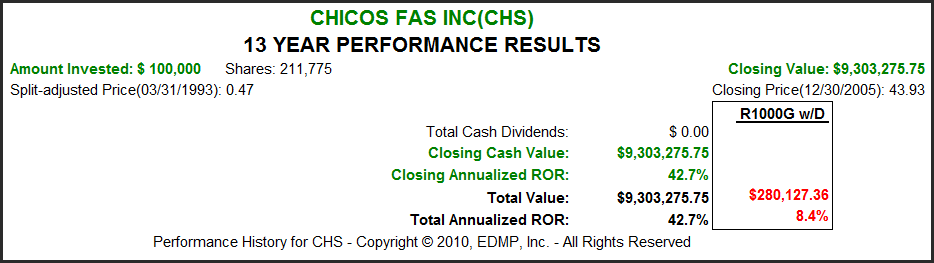
The following example of an extremely successful and fast-growing apparel retailer casts a light on the potential dangers that investors face with growth stocks. The company is Chico’s FAS Inc.(CHS), and from the F.A.S.T. Graphs below you can see that this company had an extraordinary record of earnings growth and shareholder results from 1993 to 2005. Price and earnings correlated very nicely; however, by 2005 the company’s stock price was overvalued based on my definition of fair value.
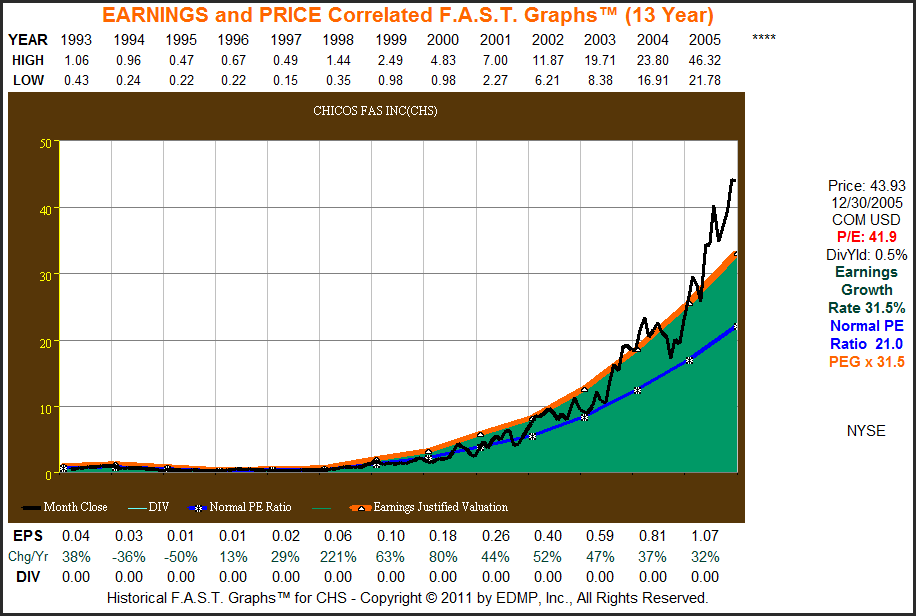
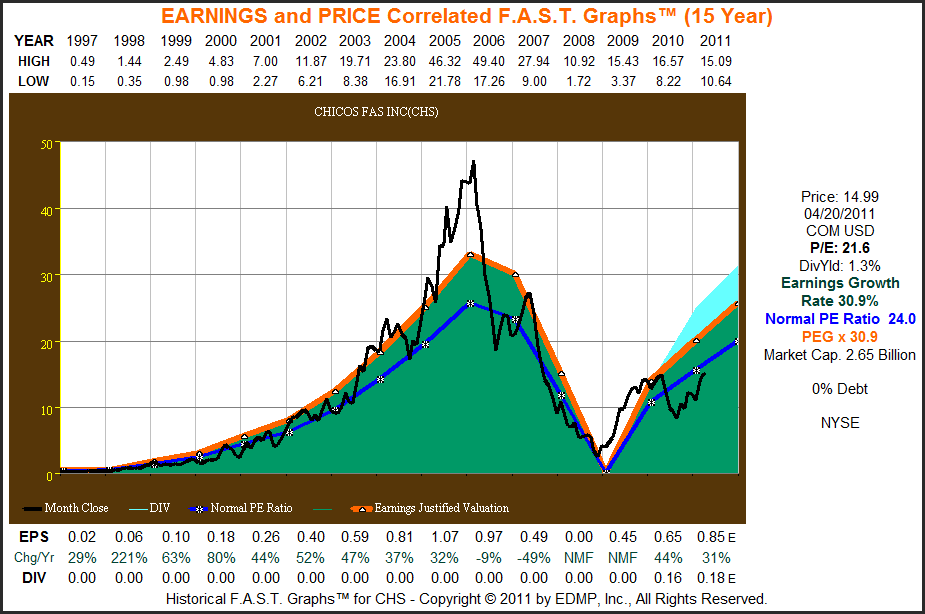
I might add, and be stating the obvious, that this was an extremely popular stock from the late 1990s into calendar year 2005. I would also like to add that expectations for continued growth were also commonly held. However, everything changed abruptly when earnings began to falter in fiscal 2007 (early calendar year 2006). With the graph below we can see the dangers of overvaluation exasperated by the effects of poor business results. As an aside, I can remember being told by many people, including business associates, that I was missing this great company. Fortunately, it was the overvaluation that kept me from owning the stock.
The Power and Protection of Diversification
Throughout this series on “Going for Growth” I have shown numerous examples of true growth stocks that have lavishly rewarded their shareholders. In my last example, Chico’s FAS, I showed the potential dangers that can also occur with growth stocks. However, I want to add that because the benefits of owning growth stocks can be so extraordinary when they succeed, I feel strongly that they should not be completely ignored. On the other hand, because they are so rare, I have always believed in owning a portfolio of true growth stocks that was diversified enough to protect capital, but concentrated enough to offer exceptional future returns.
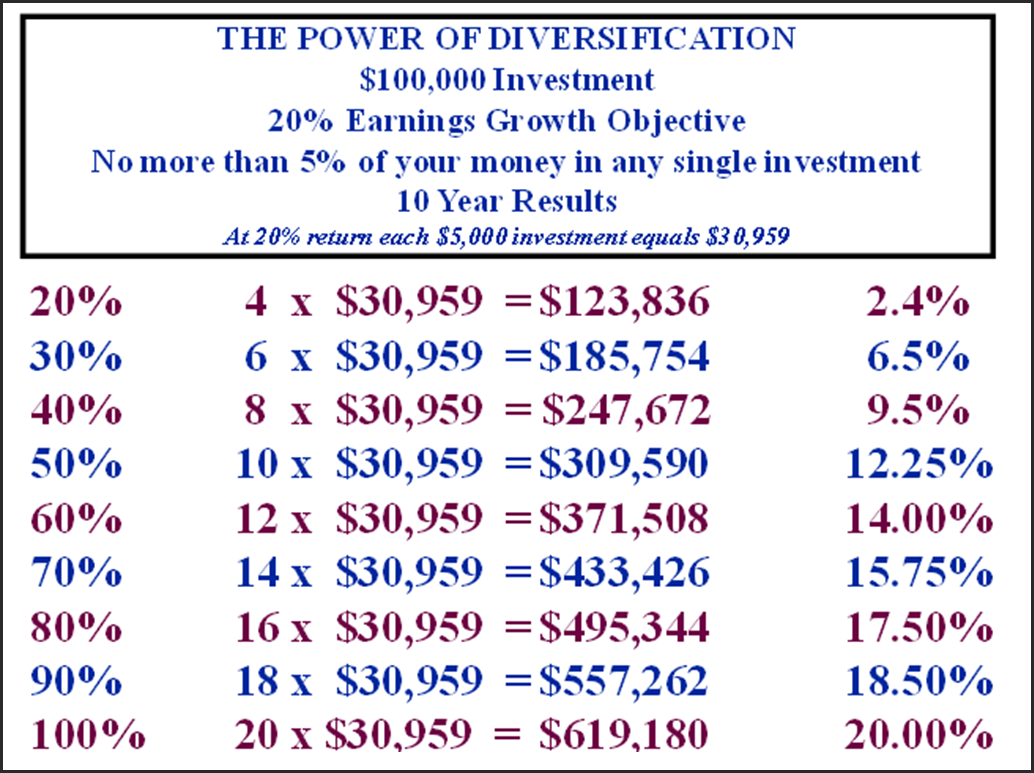
The following chart shows what I call the power and protection of a diversified portfolio of true growth stocks increasing earnings at 20% or above. This is merely a mathematical presentation, and perhaps extreme oversimplification of real world potentials. On the other hand, the math tells a very interesting story. Due to the power of compounding, the true growth stock capable of generating earnings growth of 20% or better can provide an extraordinary rate of return. The chart below shows what would happen at various percentages of success and failure. For example, if only 20%, or 4 companies in the 20 stock portfolio achieved their goals, and the other 16 companies were total failures (prices went to zero) mathematically your portfolio would still achieve a positive, albeit mediocre rate of return.
On the other hand, if only half of your companies succeeded (50%) and the other half failed, your long term return would still be exceptional. In the real world, events would probably never happen like the chart depicts. Even the Chico’s example above did not go to zero. What the math is really telling us is how powerful just getting a few true growth stocks right can be.
Conclusions
As I have attempted to illustrate with this three-part series on “Going for Growth”, the rewards for investing in this equity class can be quite substantial and exciting. Conversely, the risks of investing in this equity class can also be high and/or severe. But most importantly, I hope I have shown that there are sensible and prudent ways to participate in this dynamic category while simultaneously mitigating risks to reasonable levels. This asset class is not for everybody, and does require a great deal of diligent monitoring. There are no shortcuts or easy methods, in my opinion.
I also believe that the same can be said of investing in any asset class, to include blue-chip dividend growth stocks. One of the things that attract many investors to the dividend category is the consistency and persistence of their historical records of both earnings growth and dividend growth (Dividend Champions, Aristocrats, etc.). This is the same concept that has attracted me to the true high-growth stock category. This is why I have always included a few blue-chip moderate dividend paying growth stocks within my portfolio of more aggressive true growth stocks. Total return and the power of compounding are important concepts that I believe every investor should consider and understand. Finally, note the stocks in this series are offered as recommendations to buy or sell. As I’ve already stated, I leave that decision to the discretion of each individual investor.
Going for Growth: A Methodical Approach to Identifying Growth Stocks – Seeking Alpha
Going for Growth: A Methodical Approach to Identifying Growth Stocks – Seeking Alpha


Building the Research List

My last article provided a historical analysis of how performance is generated, and which equity class, dividend paying stocks versus non-dividend paying stocks, produced the best performance historically. The article stimulated many thought-provoking comments and ideas to include a challenge to address the issue of how investors could identify and select true growth stocks going forward and not just by the rearview mirror. If you missed the article, and are interested, the following link will lead you to it. Want to Seek ‘Significant’ Alpha? Look Beyond Dividend Stocks
Introductory Positioning Statements
Before I go on, I want to clearly establish that the method of selecting and identifying growth stocks for above-average potential return is a method that I use and am comfortable with. It should be no surprise to regular readers of my work, that a lot of my methodology is assisted by the utilization of our F.A.S.T. Graphs™ (Fundamentals Analyzer Software Tool), which has been developed and evolved over the past four decades. On the other hand, we developed this “powerful tool to think with” in order to assist us in conducting what we consider to be essential preliminary research. We believe that our tool provides “essential fundamentals at a glance,” which almost instantly enables us to determine the quality of the company being graphed, and how well it’s been managed. For investors who don’t have the advantage of our tool, the same work can be done through other sources of information, just not as easily.
But most importantly, I want to be clear that I am not arrogant enough to state that this is the best or only way to get the job done. However, I do consider the process that follows to be an intelligent and practical approach. I offer this strategy in the spirit of articles “as pointing the way to becoming a better investor” as fellow Seeking Alpha author David Van Knapp so eloquently described it in one of his comments on the article cited above. The reader is free to agree or disagree, offer suggestions and modifications, and accept or reject any or all of the process to their liking. But in the end, I am hopeful that what follows can change the perspective that I find many investors have regarding the risk associated with investing in growth stocks.
The benefits and rewards of owning and investing in true growth stocks can be extraordinary, but unquestionably the risks can be high. On the other hand, I intend to illustrate strategies that can mitigate the risks of investing in true growth stocks to a manageable and reasonable level. Diversification across various companies and industry sectors represents a key element of risk control. Consistency of the companies’ operating history is an attribute that we covet, which I believe also speaks to risk management. The level of debt a company has is an example of other quality characteristics that I feel must be exceptional before taking the risk of investing in a high-growth stock. Also, the individual investor’s perspective on price volatility, how they look at it, and how they deal with it, can have a huge bearing on perceived risk versus real risk.
An essential component of our process relates to historical perspective, which we like to refer to as “learning from the past.” However, I believe the most important component, and the most difficult one to execute, deals with forecasting future earnings. My approach is predicated on the fact and principle that forecasting future earnings and cash flows is the key to long-term investing success, for all equity asset classes, but applies most significantly to investing in true growth stocks.
It all starts with an achievable goal
I’ve long held and believe that a successful long-term investing strategy needs to start by establishing an achievable goal. For a goal to be achievable, it needs to be realistically based on real-world objectives. Although I believe in evaluating history, and taking advantage of the opportunity by learning from the past, I don’t believe in looking back too far. In other words, I feel that more modern history, for example, the last 15 to 20 years, is a more relevant, and therefore, adequate time period to look back on. The growth rate of earnings for the average company, as measured by the S&P 500 (SPY) since 1992, has been 9.4% per annum. Since 1997, the average earnings per share growth rate of the S&P 500 has been approximately 6%. Therefore, I feel that 6% to 10% earnings growth represents a good proxy for a reasonable range of average earnings growth. (Note that I am not referring to stock market price performance here, only earnings or business growth).
Since I base my entire investing rationale upon the undeniable fact that earnings and cash flow determine market price and dividend income in the long run, then an understanding of normal or average earnings growth establishes a relevant baseline from which to establish future return goals. My thesis is that if you buy a business (stock) at a sound valuation, then earnings growth and long-term returns will closely correlate. I feel it makes no sense to engage in the amount of work and effort necessary to conduct effective research if your goal is to only do average. If it’s only average you seek, then the arguments favoring investing in index funds would apply.
But, since 6% to 10% represents average growth, my first criteria is to identify quality businesses that I believe not only have grown faster than that in the past, but most importantly are capable of growing faster than that in the future. Therefore, my foundational criteria for finding true growth stocks, is to screen for growing businesses that have grown earnings at an above-average rate of 15% per year or better, over a minimum timeframe of at least 3 to 5 years, but preferably 10 years or more.
I do not like to invest too early because of high risk, but I want to be early enough to participate in an achievable above-average growth cycle. The 15% or better goal is not merely pulled out of my hat, 15% or better is a number that years of research has shown to be achievable. In other words, there are numerous examples of companies that have achieved that level of growth over long periods of time, sometimes spanning decades or more. (As an interesting aside, the gap between 10%-15% is where most blue-chip dividend growth stocks can be found).
My goal for growth stocks, which I believe to be achievable, based on what has been stated regarding average, is for a total portfolio return objective of 15% to 20% or better. However, the specific goal that I apply to the component of true growth stocks is for 20% or better. I expect to achieve this number through a blend of companies achieving different growth phases. For example, there are 15% growers that also pay dividends, typically in the 1% to 2% range, where the growth yield over a market cycle, combined with a capital appreciation component, can help me get to the 20% number. These moderately high growers will be blended with very fast growers of 25% or better, where no dividend is being paid. This is also another way in which risk can be mitigated. Blending very high-growth with moderate growth that may even pay a dividend.
There were many comments expressed in my last article, and many other articles by yours truly and other authors, which spoke to the prudence of a diversified portfolio. In my personal case I am willing to commit 30% to 40% of my total portfolio to true growth stocks. For others this may be too high an allocation, but it suits me. The more conservative among you, may well limit your exposure to true growth stocks to 20% or 10%, or even none. The choice is personal, and should be based on your own appetite for risk, desire for return, and perhaps most importantly, willingness to work hard at continuing research.
Individual Stock Selection Criteria-Screening for Growth Candidates
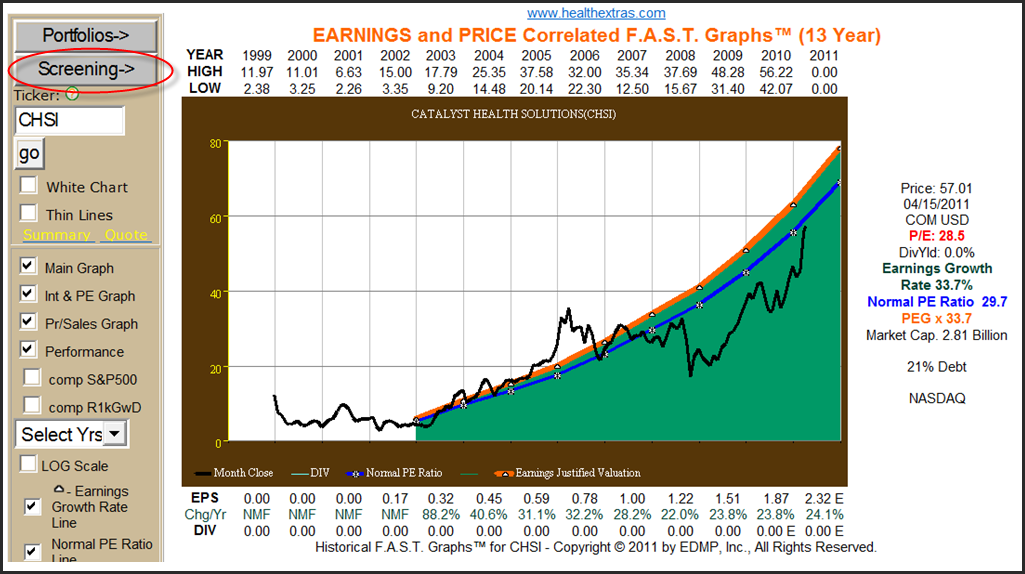
The first step in my approach to identifying potential high-growth candidates is to go to our research tool, which offers a screening function. The screenshot below illustrates the gray screen button (red circle) at the top left where this function is found. By clicking on that button I get a prompt that allows me to input criteria that I am searching for.
(Click charts to expand)
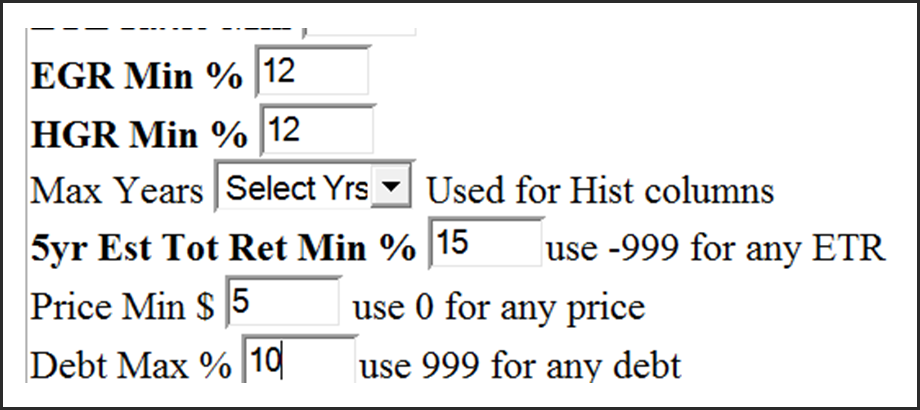
Below is a partial screenshot that is prompting me to input some of the key items I look for when searching for true growth stocks. In the example below, notice that I have asked the software to search for estimated earnings growth (EGR Min %) of 12% minimum, historical earnings growth (HGR Min %) of 12% and a five-year estimated total return minimum % of 15. I input returns slightly below my minimum 15% expectation in order not to exclude stocks based on data issues. In this example I’ve also looked for a minimum stock price of five dollars (no penny stocks) and a maximum debt level of 10%.
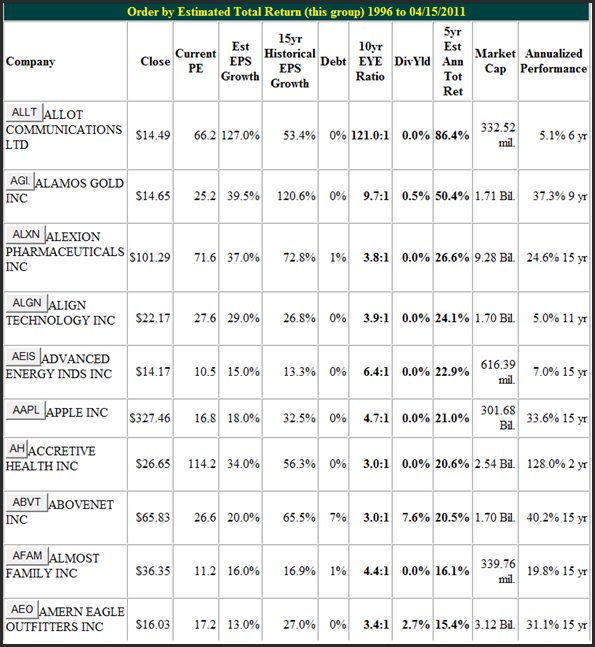
This first screen covered approximately 1,500 of the more than 16,000 available symbols. I simply keep hitting the screen button until the total data base is exhausted. This first go round produced the following example list of 10 possible candidates. At this stage, this is not a list of companies that I will actually consider for further research. The actual candidates that I’m willing to research further, require one additional filter that I consider mandatory. Even though this screen has given me exactly what I asked for statistically, this list also illustrates what I consider to be a major flaw or blind spot of statistics. As you will see, when I dig deeper, I find that some of these candidates do not fit my criteria for consistency.
The next step in my process is to click on the first symbol on the list and draw a graph, which gives me a picture providing an instant determination whether I want to include the company in my further research, or not. I continue to produce a graph on each company on this first screen rejecting the ones that don’t meet my criteria for consistency, and adding the ones that do, to a portfolio list for further study. The two examples listed below do not meet the criteria for the following reasons:
Allot Communications Ltd. (ALLT) does not possess a long enough history of consistent growth. I would require at least two more years of consistent earnings growth before I would consider further research.
Advanced Energy Industries Inc. (AEIS) has a long enough history, and technically earnings growth that met my search criteria of 12% or better. However, the high cyclicality of their historical earnings record cause this candidate to be rejected.

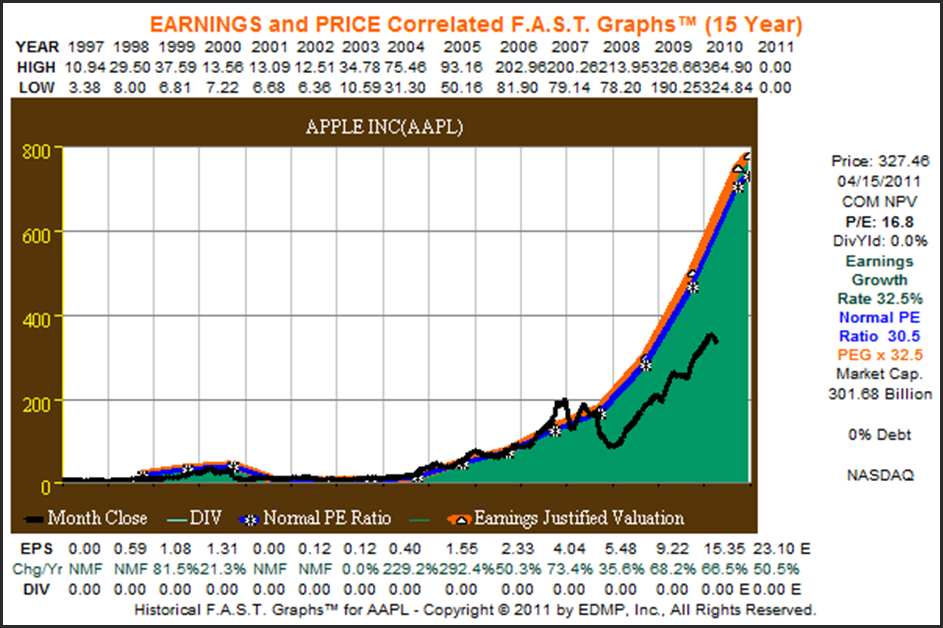
Apple Inc. (AAPL) becomes the first candidate from this first list of 10 that meet the criteria for further study, and it is added to the prospect list. You can see from the graph, Apple’s earnings have been very consistent since calendar year 2001.
Building the Research List
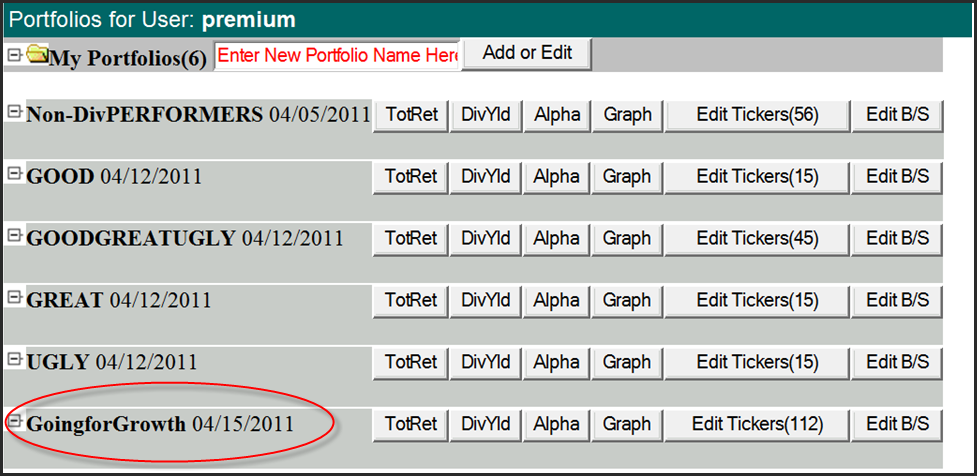
When I have completed this process I start over by raising the debt limit to 20%, then 30%, etc., up to 50% maximum. After going through this process until I have exhausted all the symbols of our database up to my maximum debt limit, I have created a “GoingforGrowth” (red circle) research portfolio list of 112 companies as seen below. (Note that the other portfolios on this list of portfolios were created for the previous article linked at the beginning of this one). Importantly, this is still not a list of companies that I would be willing to buy. Instead, it represents a list of companies that I’m willing to research deeper.
Conclusions (Part 1)
In part one of Going for Growth, I focused on selection criteria for prospective candidates based solely on historical earnings growth and other fundamentals. It’s very important to state that valuation and price have not entered the equation at this stage of the process. However, these are extremely important components that must be at attractive levels before investment would ever be made. On the other hand, companies that meet all the criteria except fair value would be continuously monitored and reconsidered, if and when, price came into attractive valuation at some future time.
In part 2, my focus will move to looking to the future, and specific candidates will be reviewed. This will be where a clearer perspective of the features and benefits of true growth stocks will come to light. Although, as I have previously stated, historical perspective is an extremely important part of the selection process, it is only the first of many steps. Furthermore, since you can never invest in the past, but only in the future, forecasting future potential is the key. In part two we look to the future.
>> Continue to Part II
Disclosure: I am long CHSI.
Disclosure: I am long CHSI.
Disclaimer: The opinions in this document are for informational and educational purposes only and should not be construed as a recommendation to buy or sell the stocks mentioned or to solicit transactions or clients. Past performance of the companies discussed may not continue and the companies may not achieve the earnings growth as predicted. The information in this document is believed to be accurate, but under no circumstances should a person act upon the information contained within. We do not recommend that anyone act upon any investment information without first consulting an investment advisor as to the suitability of such investments for his specific situation.
Going for Growth (Part 2): What to Buy, When to Buy and When to Sell – Seeking Alpha
Going for Growth (Part 2): What to Buy, When to Buy and When to Sell – Seeking Alpha


Introduction
In part one, I talked about creating a list of potential candidates of high-growth stocks based on finding companies with extraordinary historical records. I also talked about establishing realistic goals based on investing in companies whose track records would have achieved those goals. But more importantly, I am now going to focus on those companies that should be capable of continuing to generate significant above-average growth going forward. Perhaps, as you will soon see, not at exactly the same rate as they have historically, but still continuing at a future earnings growth rate high enough to meet our goals.
In my opinion, there seems to be a great deal of confusion and misunderstanding about growth stocks. Many investors automatically equate high risk and high volatility (high betas), which many equate with risk, as unavoidable components of growth stocks. Unfortunately, jaundiced views like these can scare people away from the often unbelievable benefits and rewards that growth stocks can offer. However, in reality, and when you think about it, a high beta is a prerequisite to above-average performance. We contend that fuzzy and inconsistent definitions of what growth stocks even are is a major contributing factor to this problem.
Our definition of a growth stock is straightforward and precise. First of all, a growth stock represents the common stock of a company whose business is consistently growing at a significantly above-average rate. In other words, a growth stock is a company whose earnings are consistently increasing at a minimum rate of change of earnings growth of 15% or better. However, a hyper growth stock is one that I define as growing earnings at a rate of change of 25% or better. Admittedly, although both categories are rare, there are more 15% growers than there are companies growing earnings at 25% or higher. In between these broader gradations of growth are additional growth categories such as a high grower at 20%, etc.
On the other hand, there are numerous examples of companies that achieve both of these broader levels over decades and decades of time. However, it’s important to point out that companies capable of generating the growth rates described in our definitions above are very rare. In our experience, most “studies” will include more growth stocks in their universe than actually exists. Obviously, this will dilute the results. Therefore, it logically follows that the first step in building a portfolio of pure growth stocks is through the determination of a clear and precise definition of what one actually is.
Now that I have provided my definition, let’s look and see if there are any real life examples that can stand up to my standards regarding earnings growth, past, present and future. I am going to go through these examples in alphabetical order, my initial focus will be on earnings growth, but the important principle of valuation will be highlighted and elaborated on as I move through the list. In random order, some of these names will be reasonably priced, some will be overvalued and a few will be somewhere in between. But most importantly, these are offered as potential research candidates, and no buy or sell recommendations are offered. These important decisions are left up to the reader to decide for themselves. The purpose of this article is to highlight a method of analyzing growth stocks and is therefore hypothetical in nature and substance.
Specific Growth Stock Examples
For brevity sake I am going to review seven example companies. They will range in size from large-cap to small-cap. My purpose is to illustrate that growth stocks come in all sizes and shapes. The following table provides a summary of the seven companies to include the fundamentals that will be elaborated upon.
The following analysis will include a series of F.A.S.T. Graphs™ on each of the seven sample true growth stocks. My idea is to hopefully provide thousands of words through pictures that will illustrate not only the true nature of growth stocks, but how and when to buy and sell them based on fundamental values. This was the challenge that was laid down, and I accepted. However, as I have worked to meet the challenge, I quickly discovered that one article, or even a series of articles, could not do justice to the task at hand. But I am hopeful that this exercise can at least lay a solid foundation of understanding regarding growth stocks, their potential benefits and risks. I do ask that the reader keeps in mind that this is an intellectual exercise, and should not be considered as a specific buy or sell recommendation.
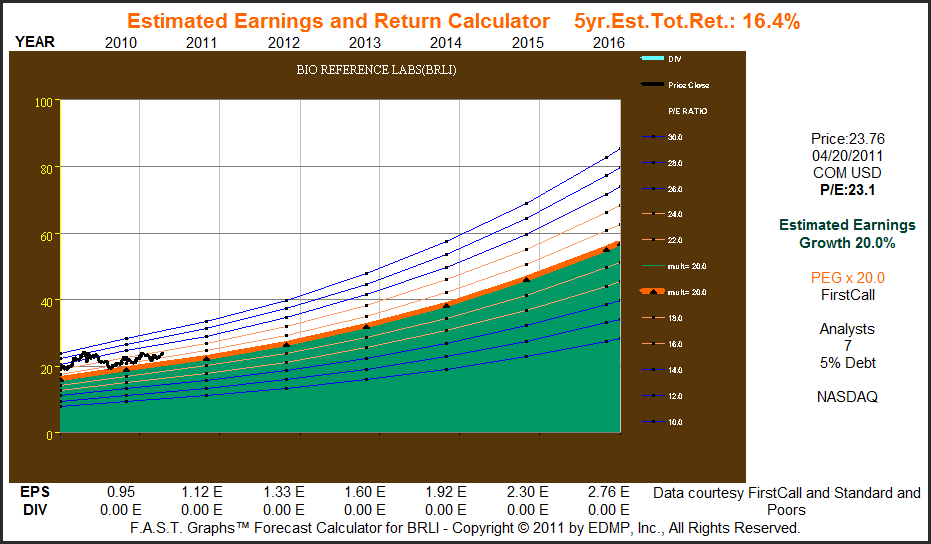
Sample 1: Bio Reference Labs (BRLI)
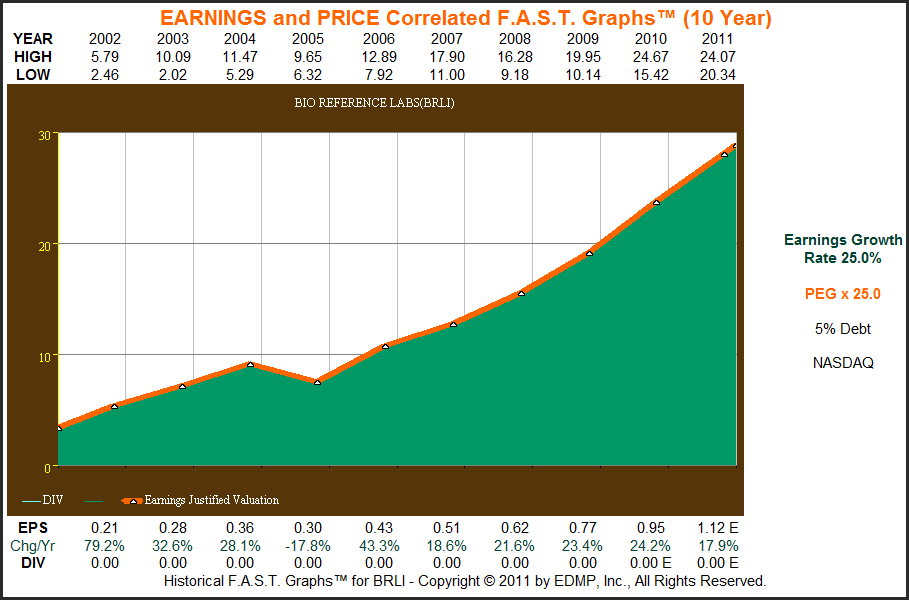
My first example is a small-cap growth stock in the healthcare services sector. From the first graph below, you can see that the company meets the criteria laid out in Part 1 of this series. This exciting small-cap has strung together a very consistent record of earnings growth (orange line) averaging 25% per annum. The company has very little debt, which is an important consideration for a small-cap growth stock.
Click to enlarge
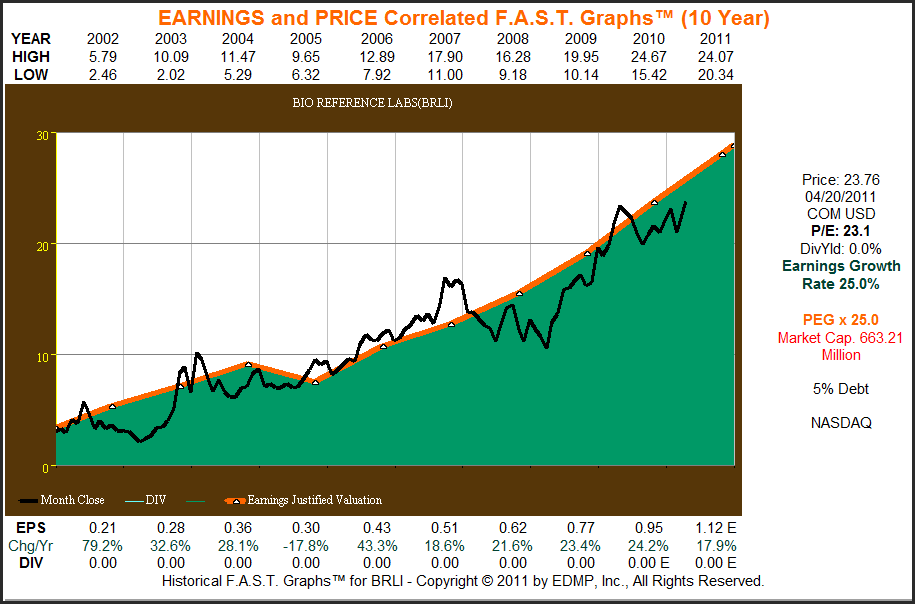
In my next graph, I overlay monthly closing stock prices. Here, the earnings and price correlation becomes vividly exposed. The black price line clearly tracks earnings, and periods of overvaluation, undervaluation and fair valuation are easily recognized. Attractive buying opportunities existed at any time the price line was touching the earnings line or below it. In contrast, the least attractive buying opportunities were manifest when the price line was above the earnings justified valuation line.
Click to enlarge
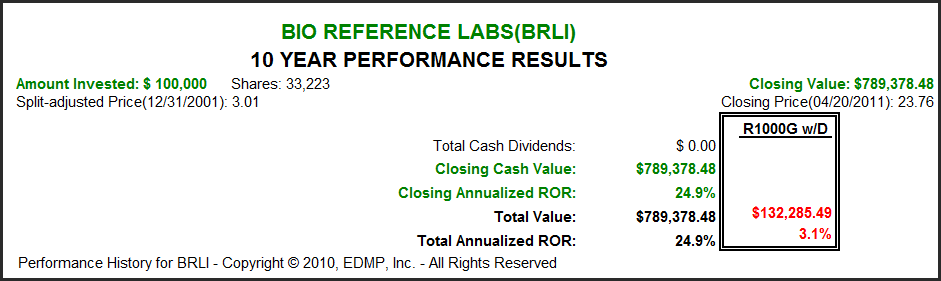
When reviewing the performance associated with the earnings and price correlated graph above, we discover that shareholders were rewarded almost in perfect proportion to earnings growth. Attractive starting valuation and only a very modest undervaluation at the end allowed shareholders to reap their just reward generated by earnings growth. This performance is in stark contrast to the performance of the Russell 1000 growth with dividends.
Click to enlarge
With my next graph I introduce the estimated earnings and return calculator based on consensus earnings estimates of seven leading analysts reporting to FirstCall. With this graph we learn that expectations are this small-cap growth stock should continue to grow earnings at a future rate high enough to maintain its status as a true growth stock. We also see that the stock is fairly valued to slightly overvalued based on those estimates. The five-year estimated total annual return of 16.9% assumes that the company grows earnings at the 20% forecast, and that the PE ratio falls from its current 22.5 to a PEG ratio PE of 20 by fiscal year-end 2016.
Click to enlarge
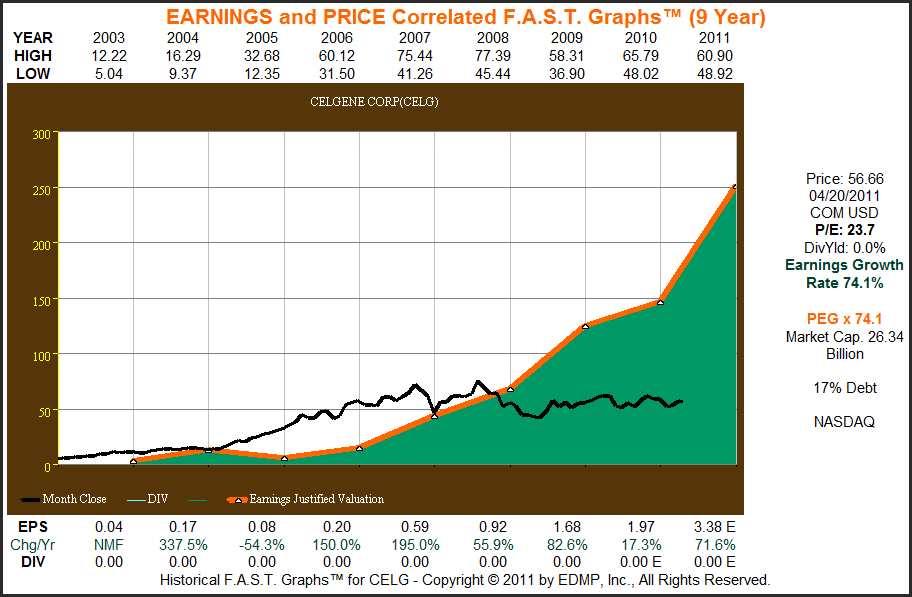
Sample 2: Celgene Corp. (CELG)
Celgene Corp. is a large-cap biotechnology company, which was originally spun-off from Celanese Corp. in 1986. They generated no earnings or earnings growth until calendar year 2004. However, since calendar year 2005, Celgene has generated earnings growth in excess of 74% per annum. Therefore, the company meets our minimum criteria of five years of above-average consistent earnings growth. Note that prior to the recession of 2008, Celgene was awarded a price earnings ratio significantly above its 74% growth rate (the orange line PE ratio is 74). In 2008, the stock price did fall precipitously due to overvaluation and the general pessimism that prevailed at that time. However, price volatility for this extremely fast-growing hyper-growth stock was not out of line with many dividend paying blue chips at the time. Companies like Procter & Gamble (PG), Colgate-Palmolive (CL), PepsiCo (PEP) and many others experienced price action that was very similar. But most importantly, Celgene’s earnings growth has remained extremely strong, illustrating a great deal of recession resistance.
Click to enlarge
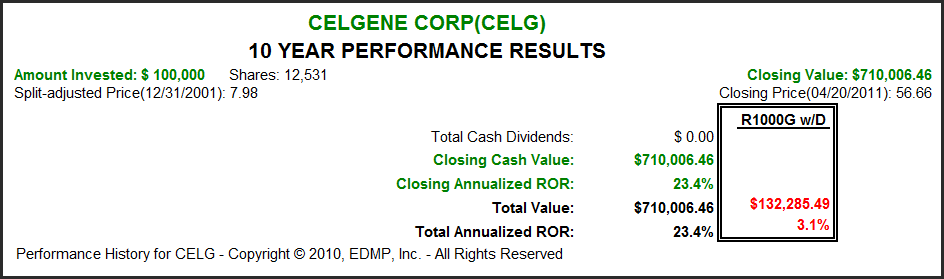
From the associated performance results shown below, Celgene shareholders have been amply rewarded by the company’s extraordinary earnings growth since calendar year 2002. On the other hand, since calendar year 2008, shareholder returns have only averaged a modest 6.2% even though earnings continued to grow in excess of 50% year.
Click to enlarge
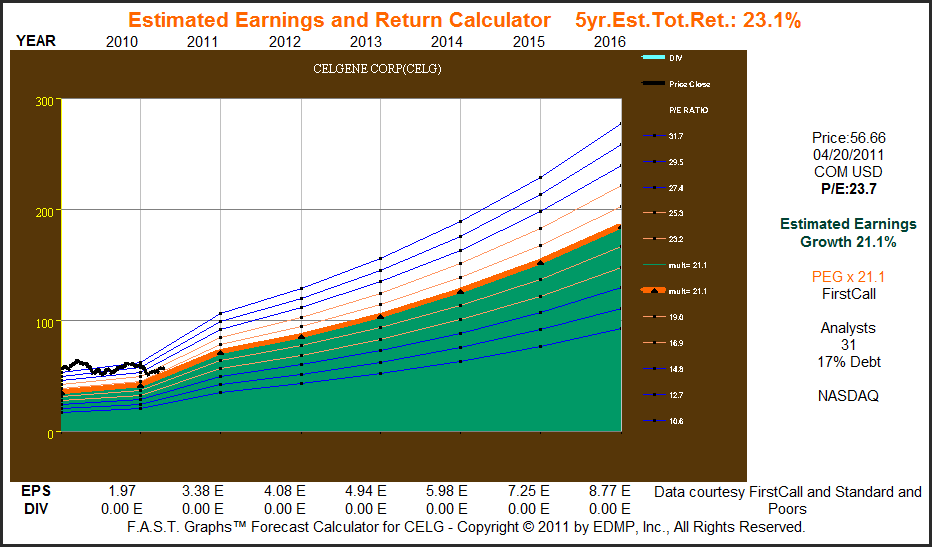
The consensus of 31 leading analysts expects this large-cap biotech stock to grow earnings in excess of 20% per annum over the next five years. Therefore, the current price earnings ratio of 24 appears modestly high. In theory, my discipline dictates that I would only be willing to invest when the price-earnings ratio is equal to or less than my expected earnings growth rate. Consequently, I would not yet be an investor. However, a more aggressive investor willing to take slightly more risk might consider this a reasonable price or valuation.
Click to enlarge
Sample 3: Catalyst Health Solutions (CHSI)
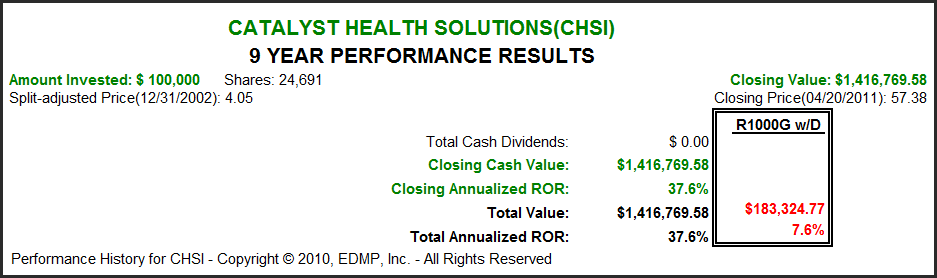
Catalyst Health Solutions is a major healthcare services company with a niche approach to pharmacy benefit management. As the graph below clearly depicts, this high quality company has generated an impressive string of consistent earnings growth for the past eight years which exceeded 33% per annum. Although stock price has tracked these impeccable earnings very nicely, the company was clearly overvalued in 2006, and has been undervalued since 2007 based on earnings. When viewed in this way, it is clear that a good buying opportunity exists anytime the stock price coincides with the orange earnings justified valuation line, the least attractive time to buy is when price is above earnings, and the most attractive time to buy is when price is below earnings.
Click to enlarge

Once again we see a strong correlation between earnings growth and shareholder returns in the long run. The benefits of consistent and strong earnings growth are clear, and overcome short-term bouts of volatility.
Click to enlarge
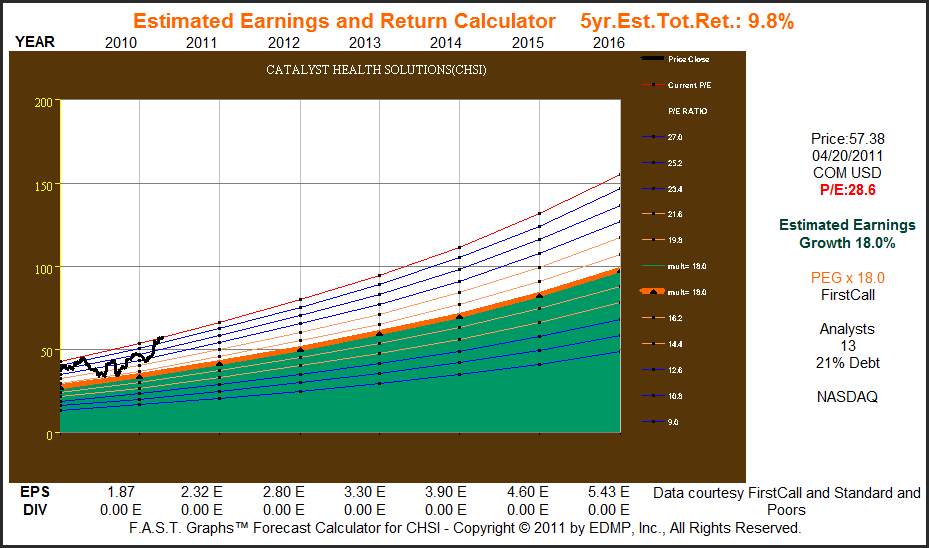
The consensus estimates of 13 analysts expect Catalyst Health Solutions to continue growing earnings at a rate of 18% per annum over the next five years. However, if those estimates prove correct, then this quality healthcare company is technically overvalued at just under 28 times earnings. Although this would still be a strong rate of earnings growth, the prudent growth stock investor would patiently wait for a better entry point, like the ones that existed in July or October of 2010.
Click to enlarge
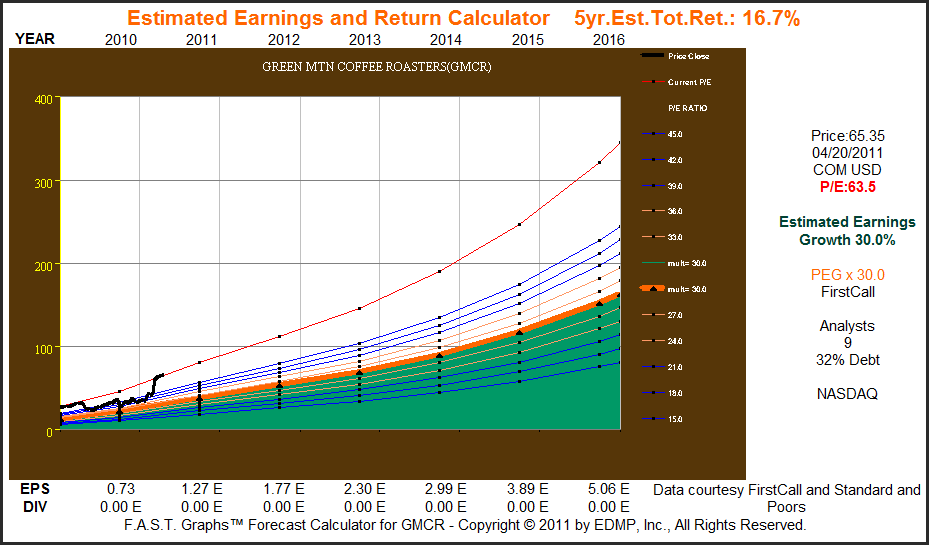
Sample 4: Green Mountain Coffee Roasters (GMCR)
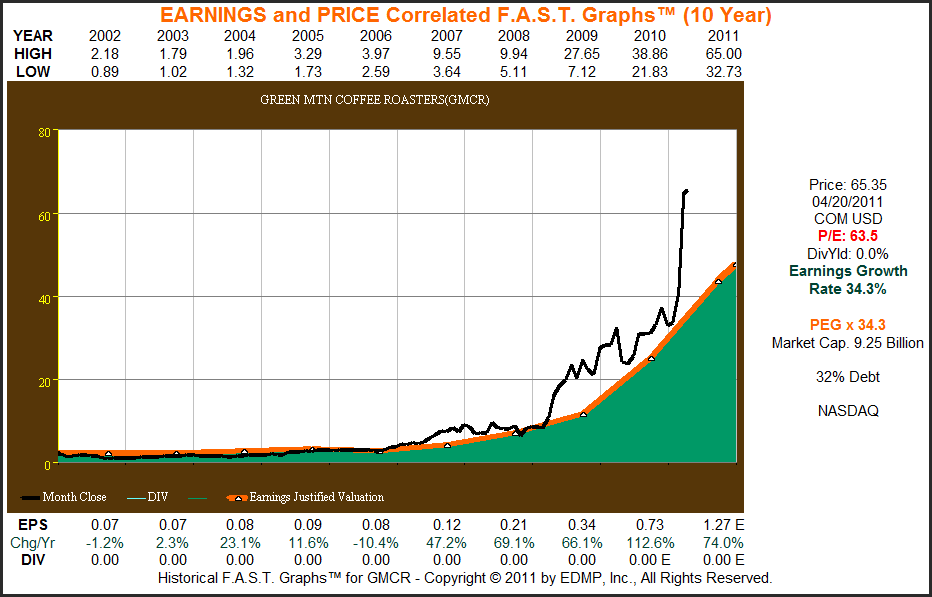
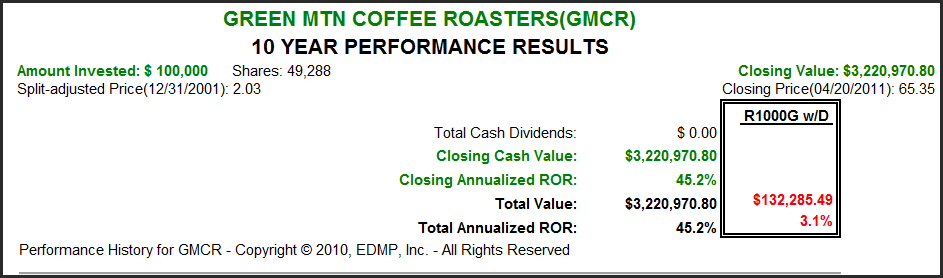
Here we find an example of a high-quality growth stock with an impressive earnings record and an irrationally exuberant stock price. I believe it is situations like this (and Netflix, our next example) that have given growth stocks a bad name. By reviewing the earnings and price correlated graphs below, and the accompanying performance results, we see that stock price has exceeded earnings growth and therefore, shareholder performance of over 45% per annum is greater than the rate of earnings growth of 34.3%.
Click to enlarge charts
The consensus of nine analysts expects Green Mountain Coffee Roasters to continue growing earnings at 30% or better for the next five years. However, the current PE ratio of 62.5 is more than twice this expected growth rate which I feel significantly expands the risk while simultaneously lowering the return potential. My rule of thumb self-discipline is to consider selling when the stock price rises to the extent that it is more than two years ahead of the earnings justified level. Green Mountain Coffee Roasters’ stock price exceeds that boundary; therefore, if I owned it I would consider selling it here.
Click to enlarge
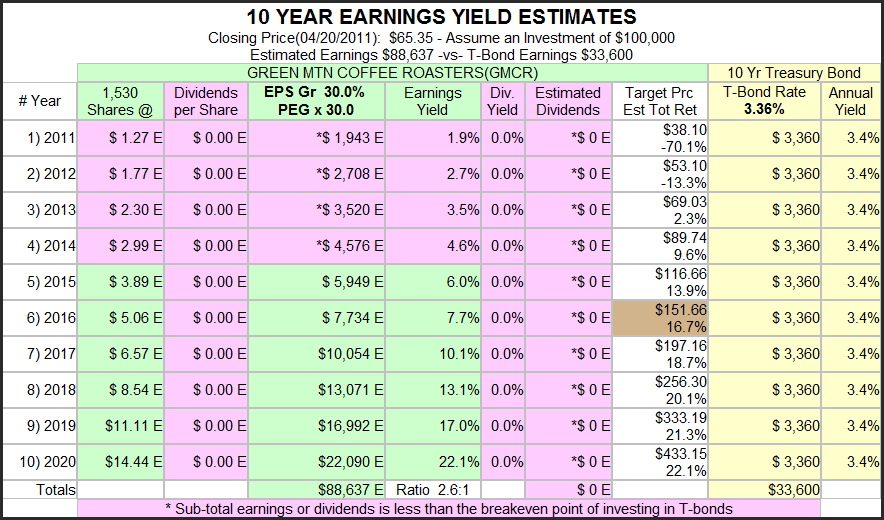
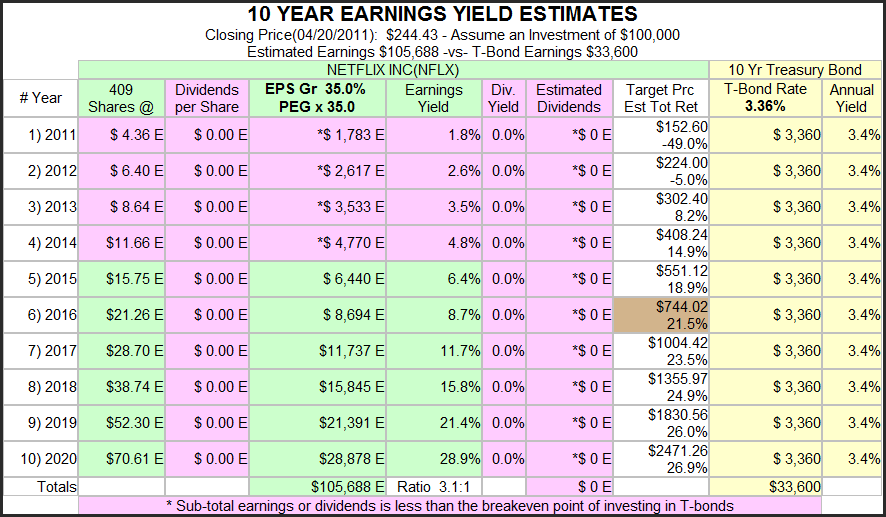
The following graph represents the current and future estimated earnings yield for this company over the next 10 years assuming earnings growth of 30%. The 10-year timeframe is used in order to compare the equivalent investment in 10-year treasury bonds. The pink shaded area implies that this company’s earnings yield would be less than the interest yield on the 10-year treasury bond for the next four years (calendar year 2014). This is a simple valuation check that illustrates overvaluation.
Click to enlarge
Sample 5: Netflix (NFLX)
The following graphs on Netflix tell a very similar story to what we saw with Green Mountain Coffee Roasters. We see an impeccable earnings history that has created an exuberant stock price valuation. Although expectations for future earnings growth are extremely high at over 35% per annum, the current PE of 67.7 significantly overvalues that potential future performance. As a growth stock investor, I limit the price earnings ratio I am willing to pay to 35, even for companies like these last two examples that are growing much faster than that.
Click to enlarge
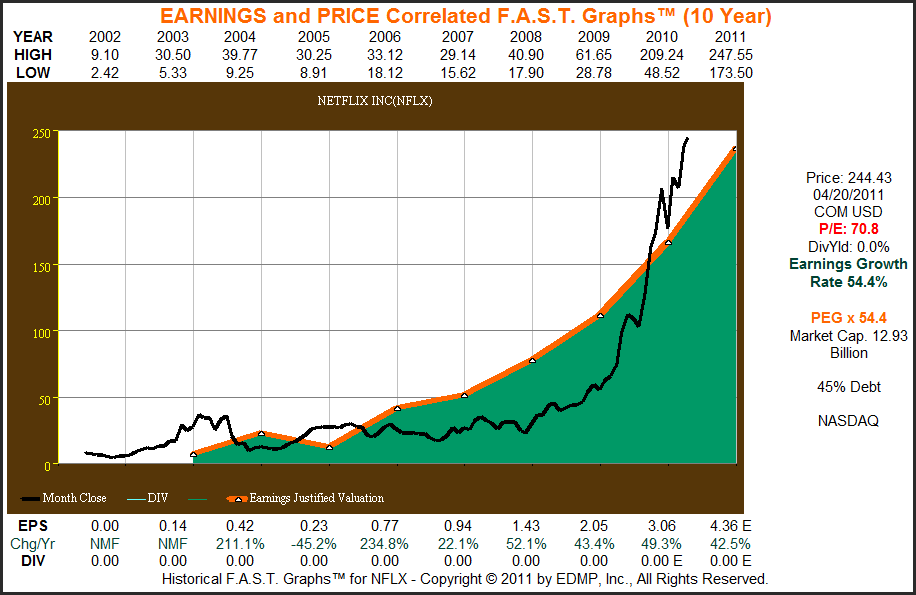
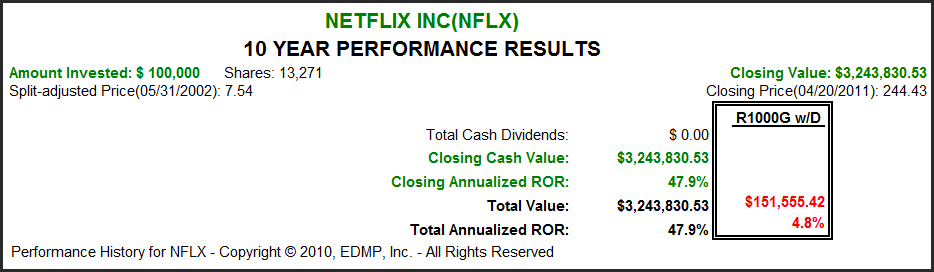
Netflix’s exceptional earnings growth record has generated outstanding shareholder returns. But from the graph above, it’s clear that price is currently extended.
Click to enlarge
Continued growth of over 35% a year is expected by the consensus of analysts. However, with the PE over 67, the stock price is clearly more than two years ahead of expected earnings justified levels.
Click to enlarge

The current earnings yield on Netflix is less than the interest you could earn on the 10-year treasury bond. And even at 35% expected earnings growth, it would stay that way until late 2014.
Click to enlarge
Sample 6: Oracle (ORCL)
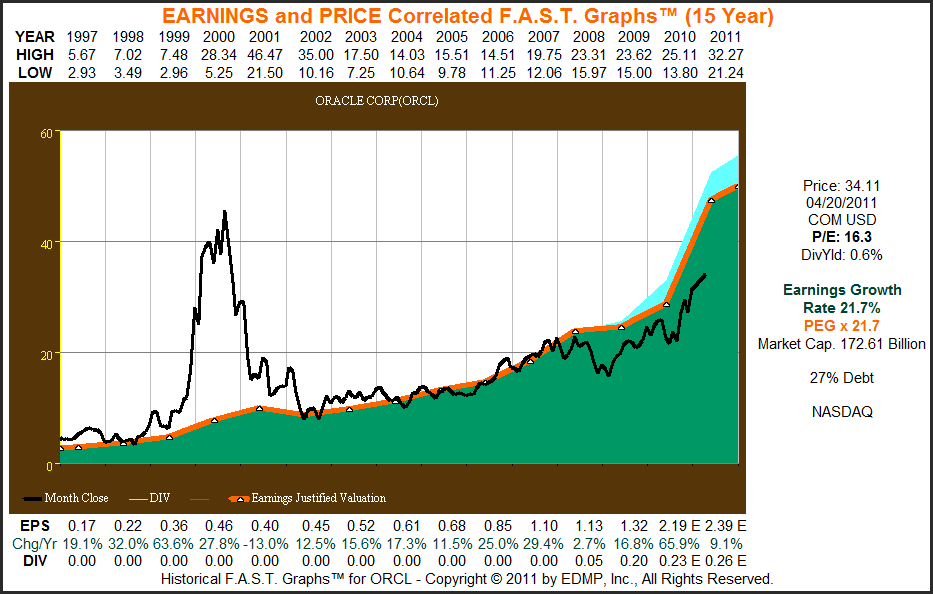
The following graphs on Oracle teach several very interesting lessons on growth stock investing. First of all, as can be clearly seen in calendar years 1999 and 2000, the stock market can often totally and even outrageously incorrectly price a stock. With Oracle, in 1999 and 2000 we saw a quintessential example of not only irrational exuberance, but a bubble as well. Then from 2002 through 2007, we see a true picture of stock price tracking earnings and we’re given a good perspective of the volatility of a growth stock. Then in 2008, we see a sharp falloff in stock value even though earnings held up. Finally, as is currently true with most of the big technology names, we see the initiation of Oracle’s first dividend (light blue shaded area).
Click to enlarge
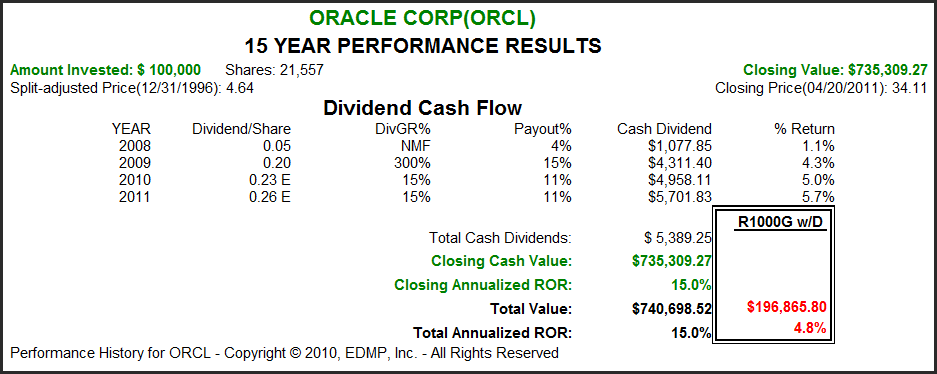
When we review the associated performance of the above graph we see the effects and the importance of valuation. Modest overvaluation at the beginning of 1997 coupled with historical low valuations currently leads to shareholder returns that are lower than earnings growth. On the other hand, the power of earnings can also be appreciated when this performance is compared to the Russell 1000 growth.
Click to enlarge
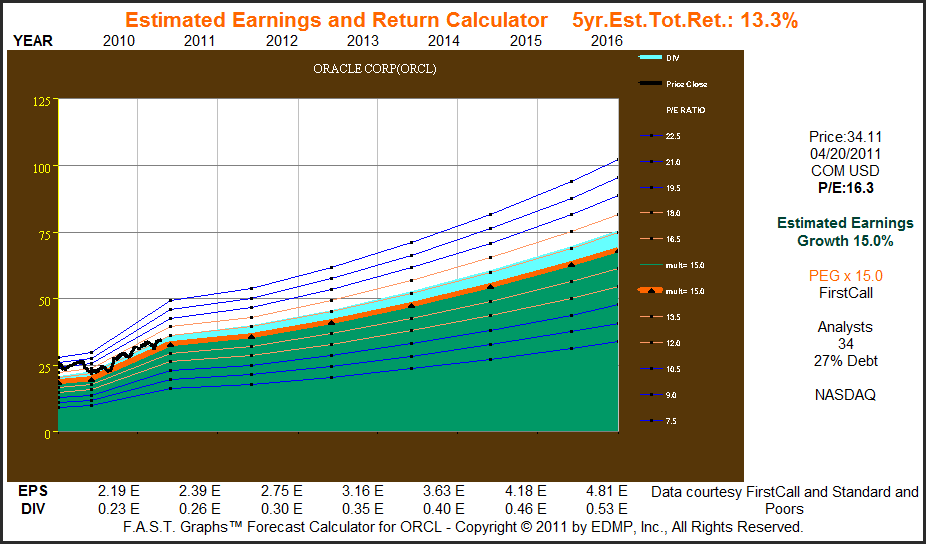
With the consensus of 34 analysts expecting future earnings growth of 15%, Oracle appears fully, but perhaps still reasonably valued at 16 times earnings. For the disciplined growth investor, waiting for a minor correction that could bring the PE ratio back to 15 or below might be a reasonable idea. On the other hand, with the company now paying a dividend that logic would expect to grow with earnings, today’s valuation may make sense.
Click to enlarge
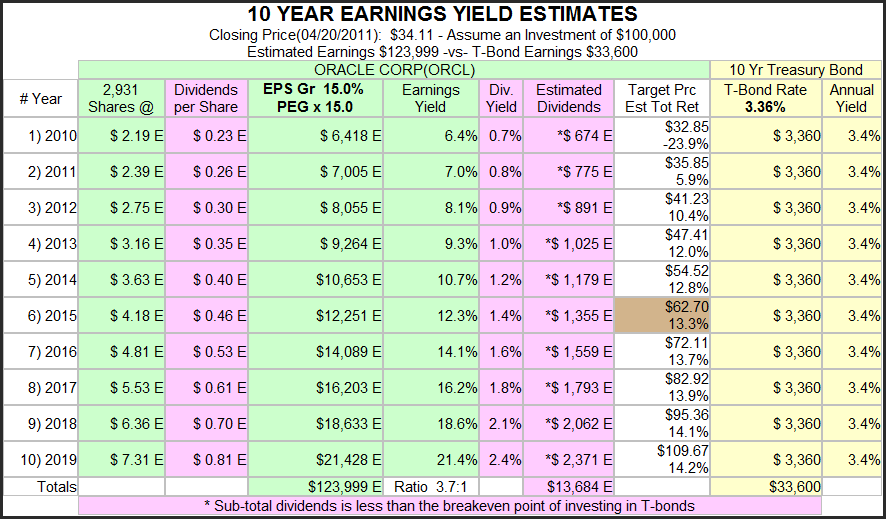
In contrast to Green Mountain Coffee Roasters and Netflix, we see that the earnings yield for Oracle exceeds what is available from the interest yield on the 10-year treasury bond. As previously stated, I consider this a good valuation check. It never makes sense to me to invest in a stock and take the associated risk when it would offer me less return from earnings than I can get from interest on the 10-year treasury bond.
Click to enlarge
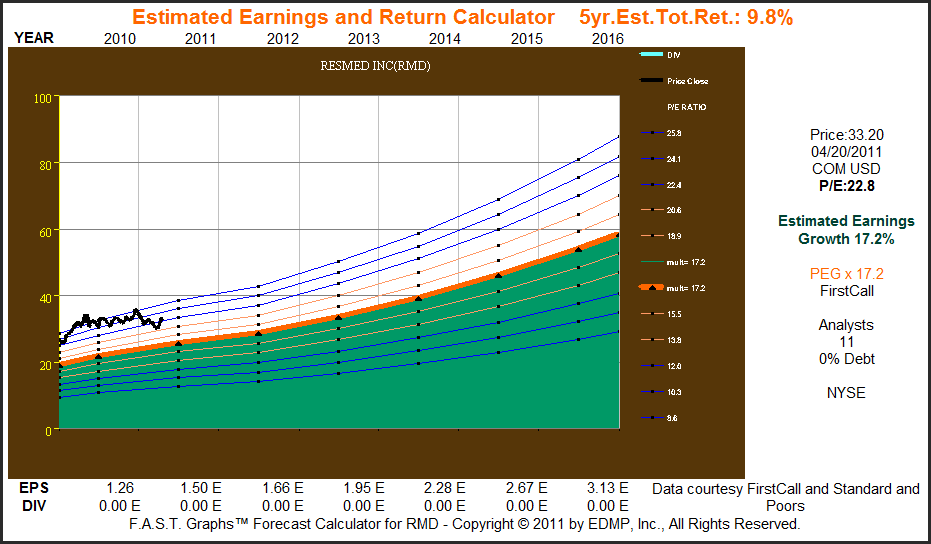
Sample 7: Resmed (RMD)
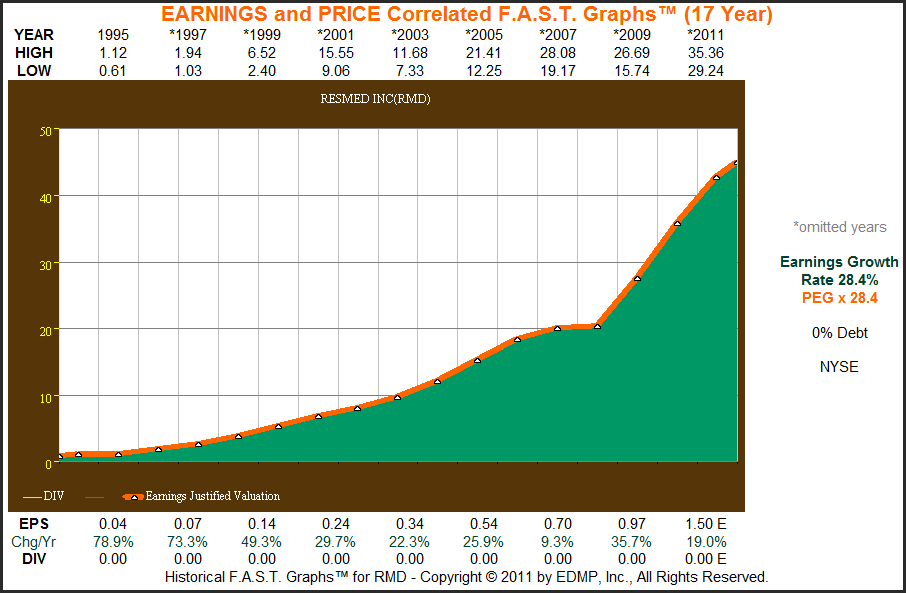
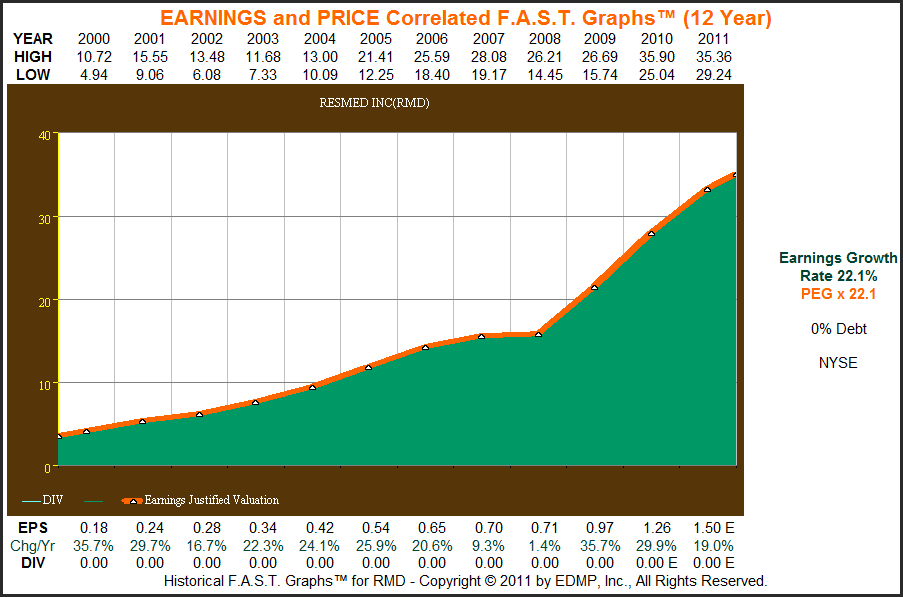
With my last example I want to interject another tactic or strategy that I apply when evaluating prospective growth stocks utilizing our F.A.S.T. Graphs research tool. I will often start by drawing a long-term graph and then cutting five years off consecutively and re-drawing the graph. The F.A.S.T. Graphs is a dynamic tool that automatically recalculates all the data. Therefore, by drawing shorter and shorter graphs, I can determine whether earnings growth is decelerating, accelerating or staying basically the same. As you might suspect, with most companies earnings growth tends to slow as the company gets bigger. From the next three graphs below you will discover that Resmed’s earnings growth rate was 28.4% per annum since 1995 (17 years), which dropped to 22.1% since calendar year 2000 (12 years) which fell to 19.7% since calendar year 2005 (seven years). Through this analysis I have determined that although the earnings growth rate has lessened, when you consider this includes the great recession, it has remained quite robust.
This is also where the estimated earnings and return calculator, or as I like to call it my forecasting tool, comes into play. Although I feel that a review of the recent past can provide significant insight into the strength of the business and how well it has been managed, I can only invest for the future. Therefore, although I feel I learned from the past, I always focus my decisions on my best expectations of the future earnings growth of the business. Consequently, based on this preliminary research up to this point, my confidence in strong above-average future earnings growth is high. This confidence motivates me to consider a more comprehensive research effort, as long as current valuation also coincides and make sense.
Click to enlarge charts

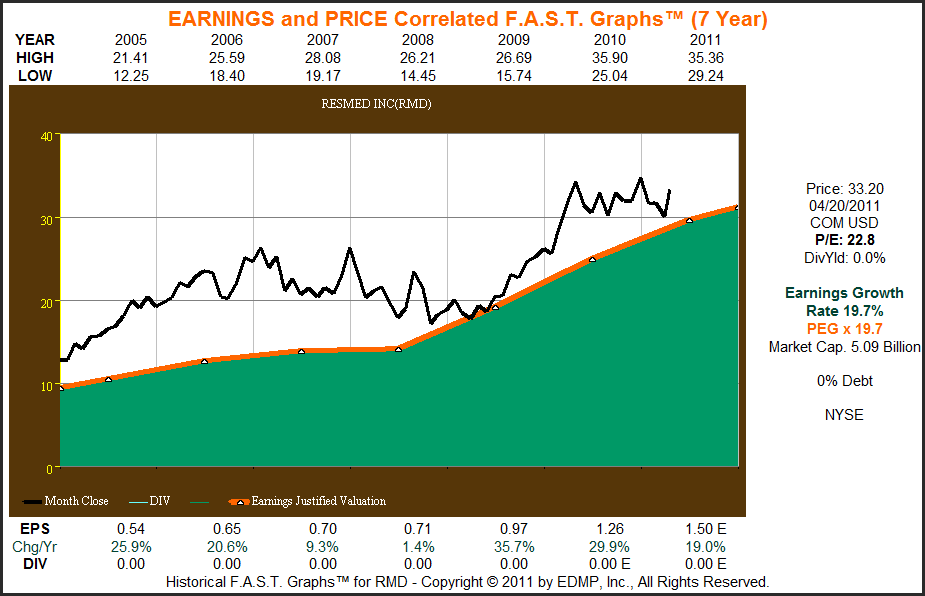
Based on the consensus estimate of 11 analysts, the future earnings growth of Resmed seems both attractive and reasonable. However, with earnings growth estimated at 17.2%, the current PE ratio of 22.6 seems high. As a result, I will refrain from investing the time and effort of looking deeper into this company until the valuation is more attractive. Thankfully, my graphs automatically keep track of valuation and therefore will alert me when valuation becomes in-line. At that time I would institute a more comprehensive analysis with a high confidence that this effort will lead to an attractive purchase.
Click to enlarge
(Follow this link to a short video providing a more comprehensive and dynamic review of the seven potential growth stock candidates.)
Concluding Remarks
In part one of this three part series, the focal point of my strategy behind putting together a growth stock portfolio has been a consistent above-average history of earnings growth. The central idea is where better to look for future growth than from where it has already been consistently achieved. A long history of consistently above-average growth seems unlikely to be accidental. In this, part two, the focal point was on identifying prospective growth stocks where the consensus expected future growth rate was at a rate high enough to meet my definition of a growth stock.
In part three, the focal point will be on the vitally important task, and I believe key, to investment success with growth stocks. Part three will deal with a more comprehensive look at forecasting future earnings.
Disclosure: I am long ORCL, CHSI, PG, CL, PEP.
Disclaimer: The opinions in this document are for informational and educational purposes only and should not be construed as a recommendation to buy or sell the stocks mentioned or to solicit transactions or clients. Past performance of the companies discussed may not continue and the companies may not achieve the earnings growth as predicted. The information in this document is believed to be accurate, but under no circumstances should a person act upon the information contained within. We do not recommend that anyone act upon any investment information without first consulting an investment advisor as to the suitability of such investments for his specific situation
